Best Custom Data Visualization Service Provider on the Globe
Seasoned Data Visualization Expert
We are experts in custom development and specialize in enhancing digital products with advanced data visualization.
- 0 +
- Years in Data
Visualization Market
- 0 +
- Data Visualization
Experts on Board
- 0 +
- Delivered
Projects



Visuals We Use In Data Visualization

 ×
×
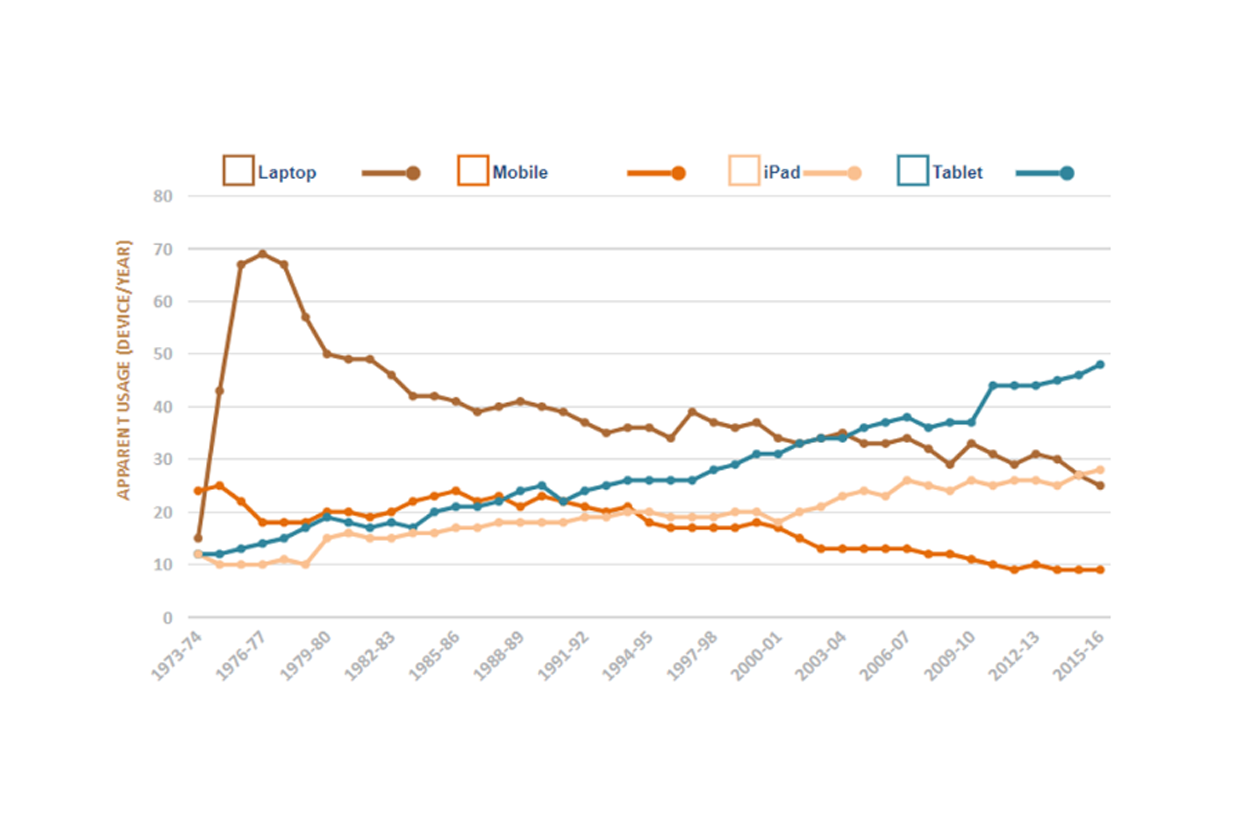
Line charts

 ×
×
Bar charts

 ×
×
Pie charts

 ×
×
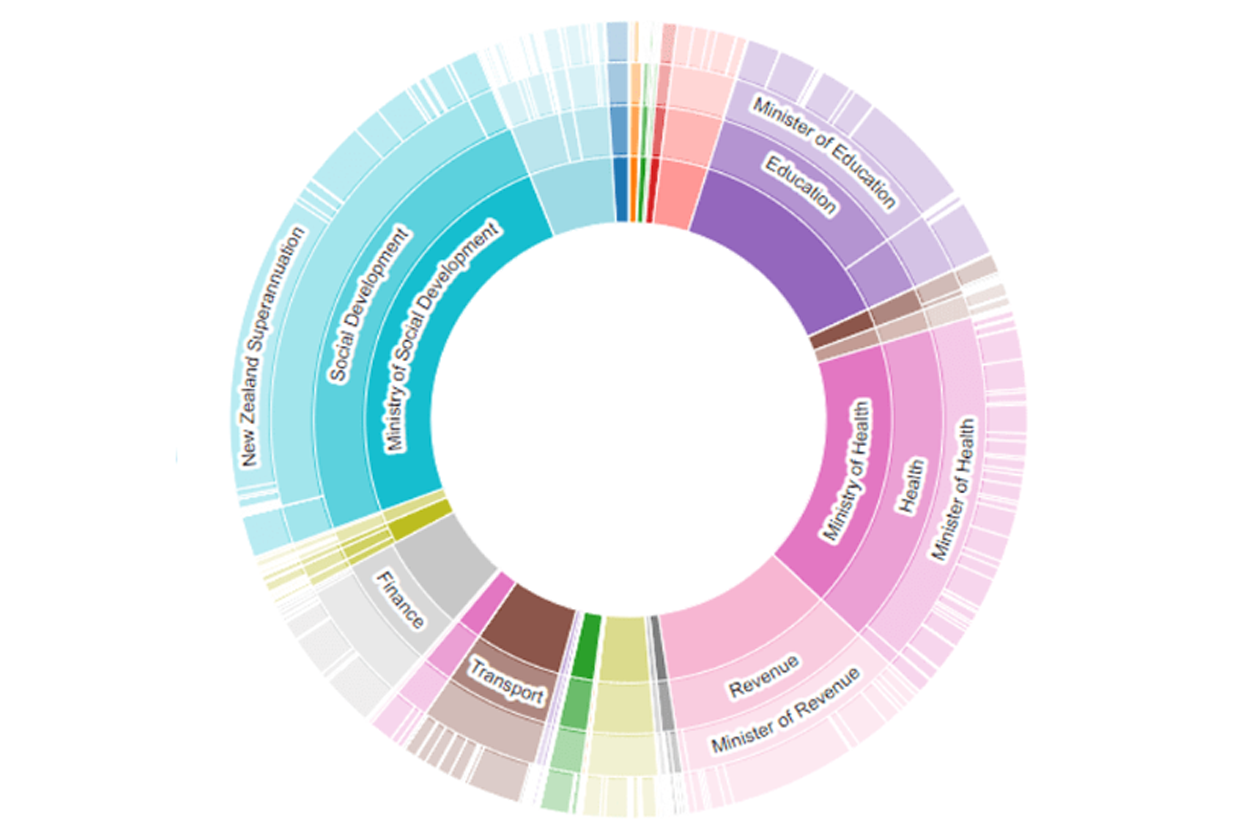
Donut charts
 ×
×
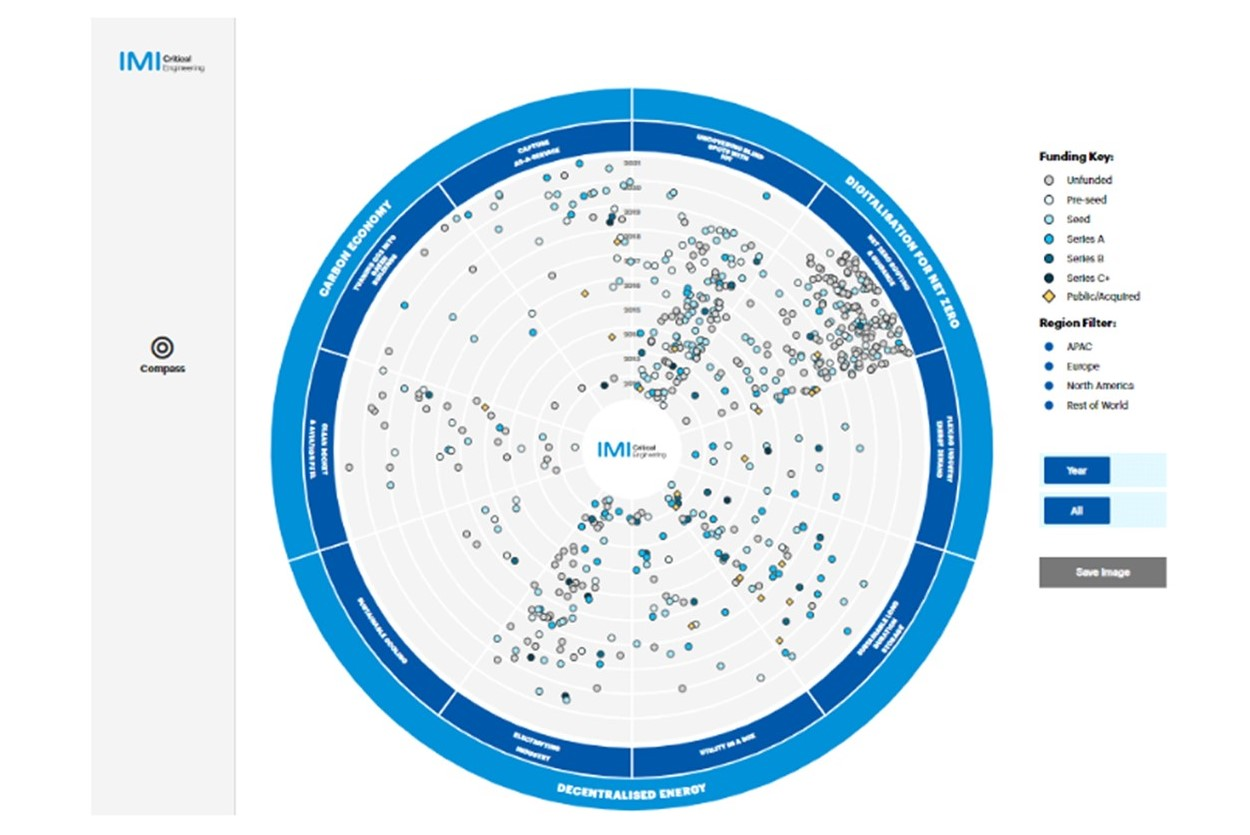
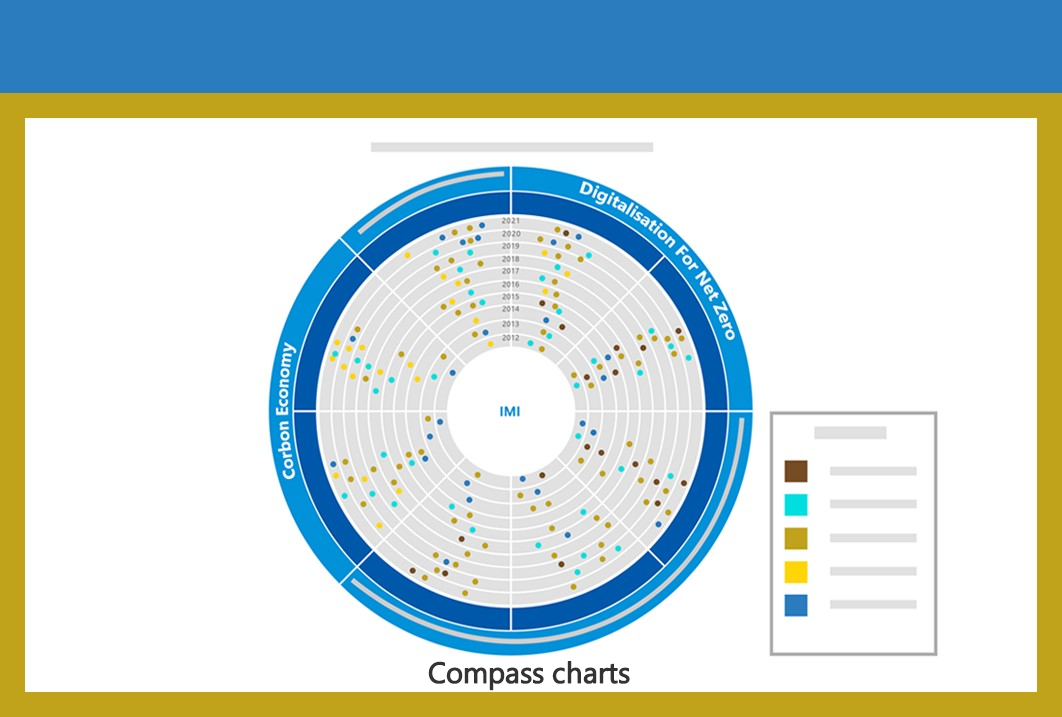
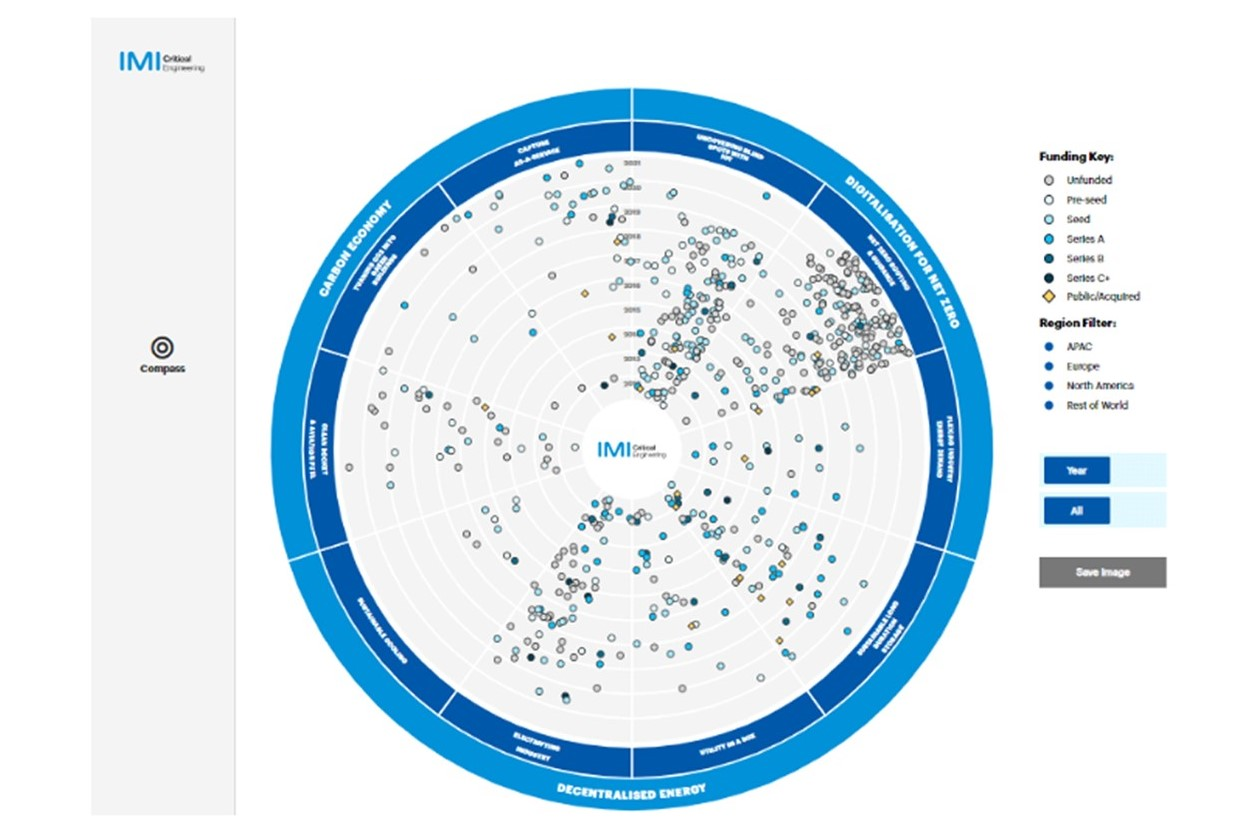
Compass charts
 ×
×
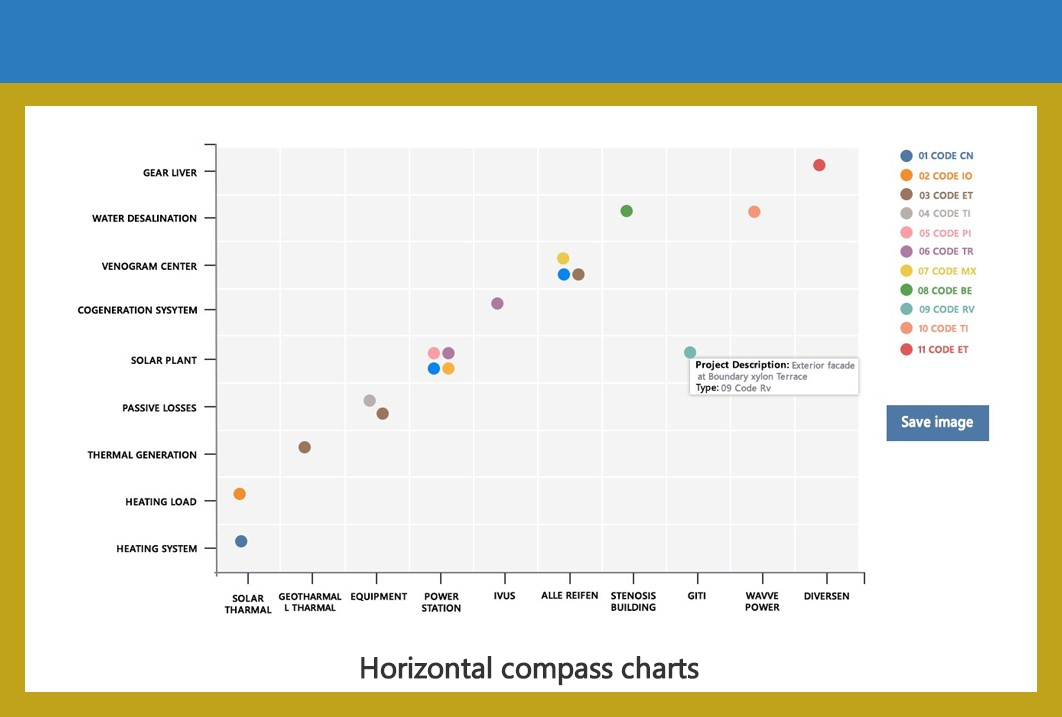
Horizontal Compass charts

 ×
×
Maps
 ×
×
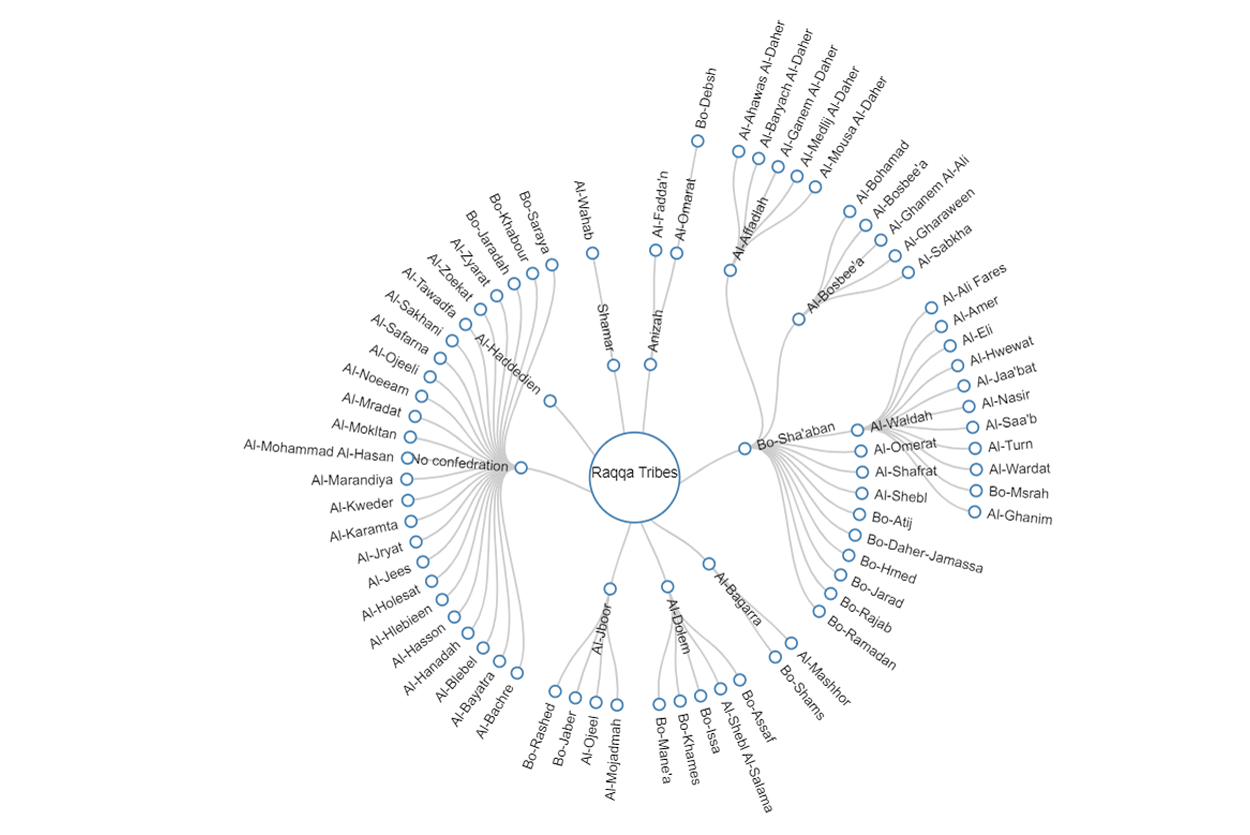
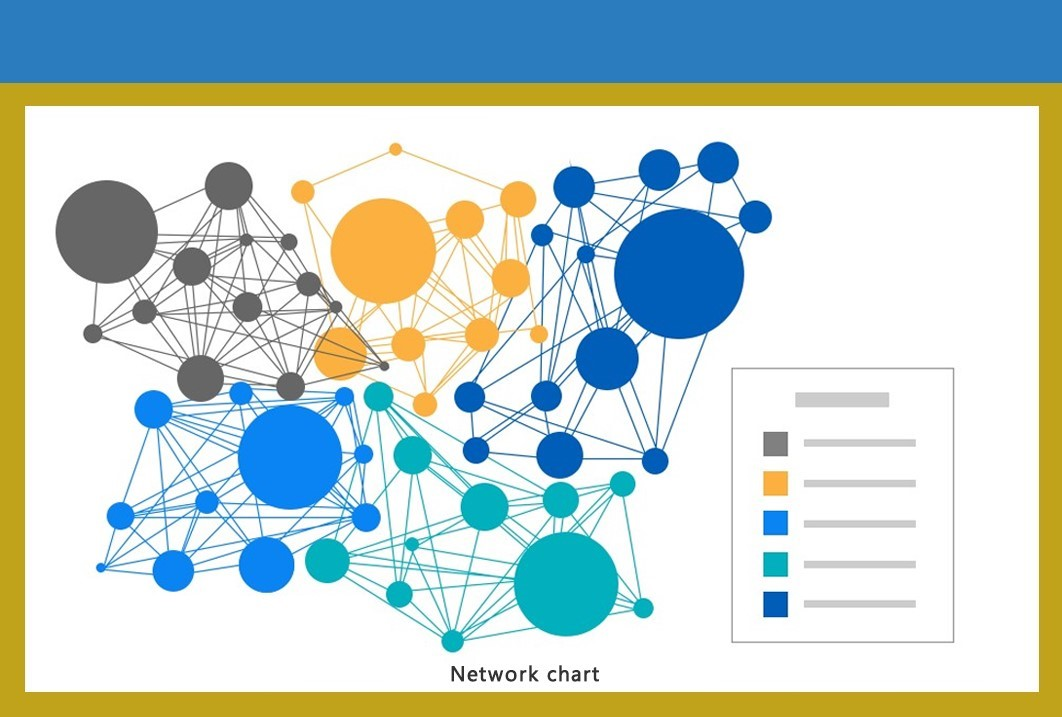
Network charts
 ×
×
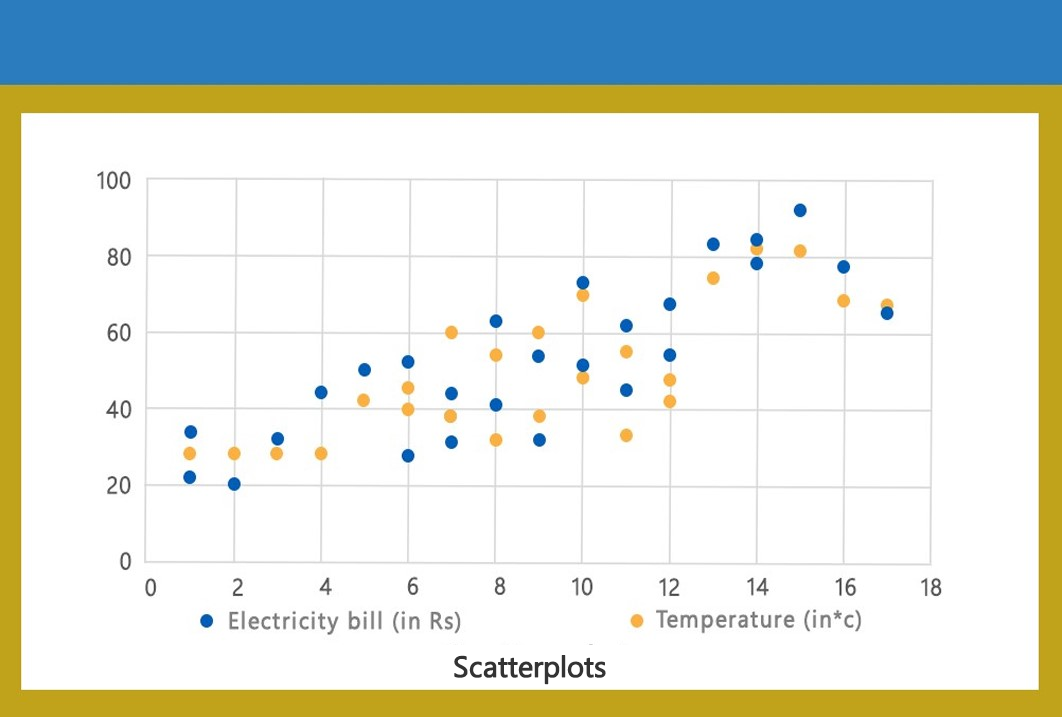
Scatterplots
 ×
×
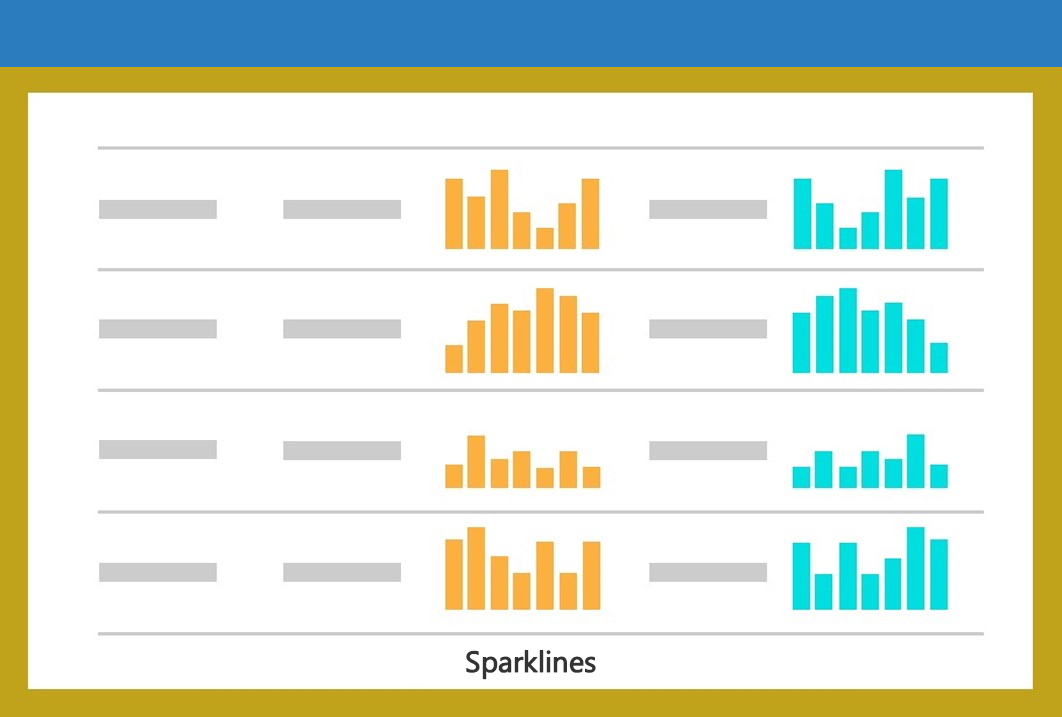
Sparklines

 ×
×
Heat maps
 ×
×
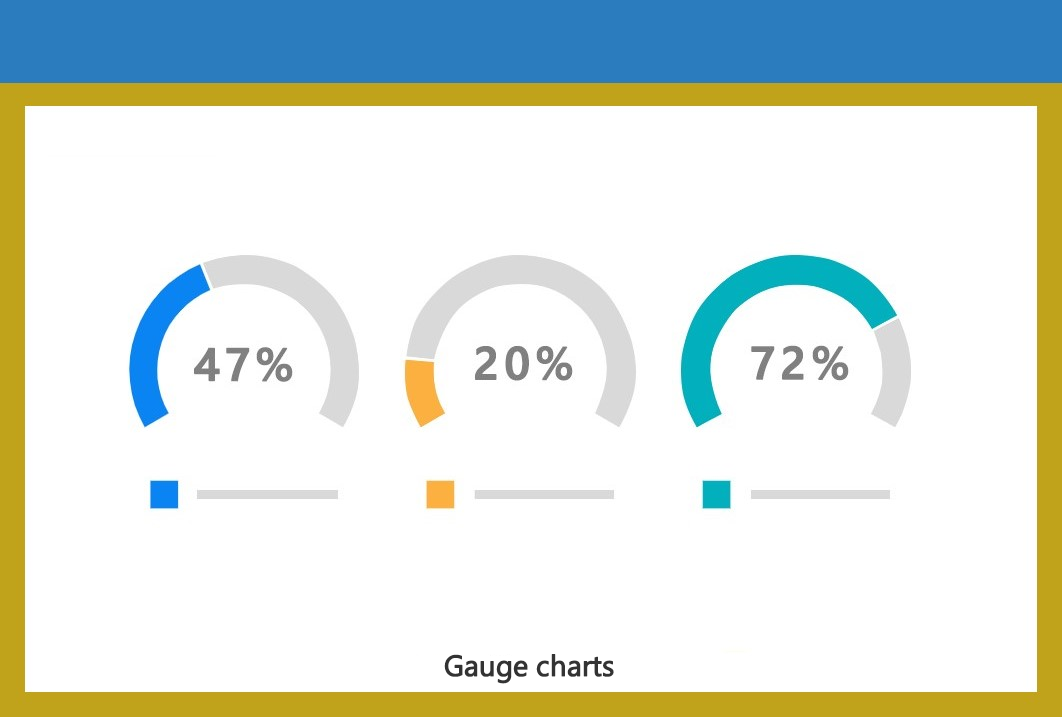
Gauge charts
 ×
×
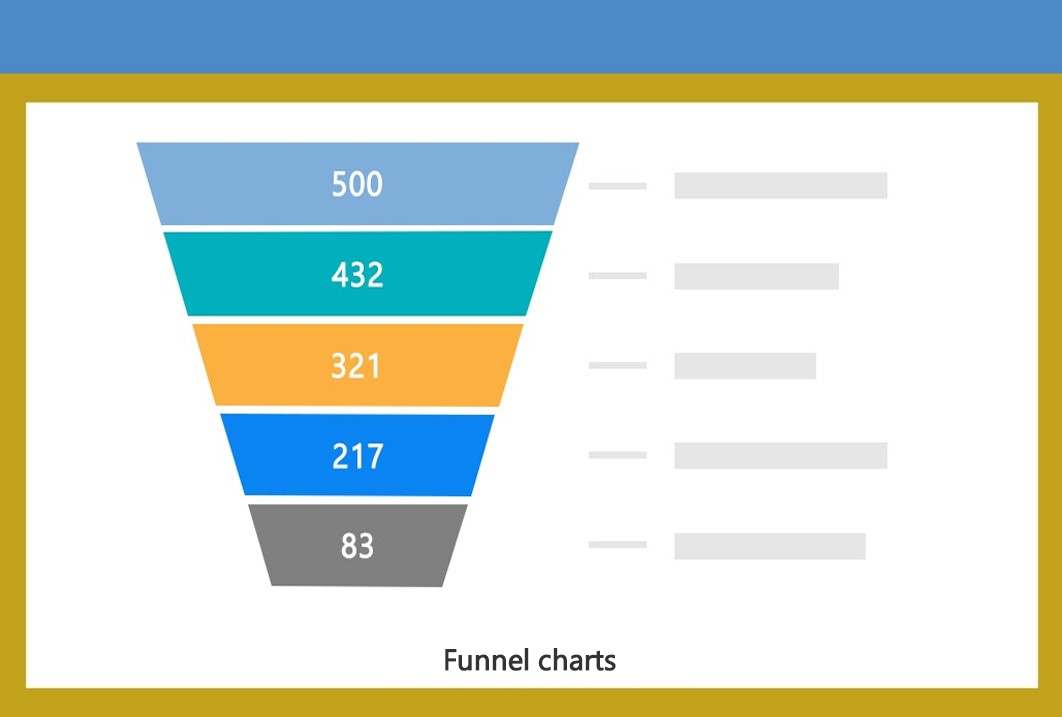
Funnel charts

 ×
×
Waterfall charts
 ×
×
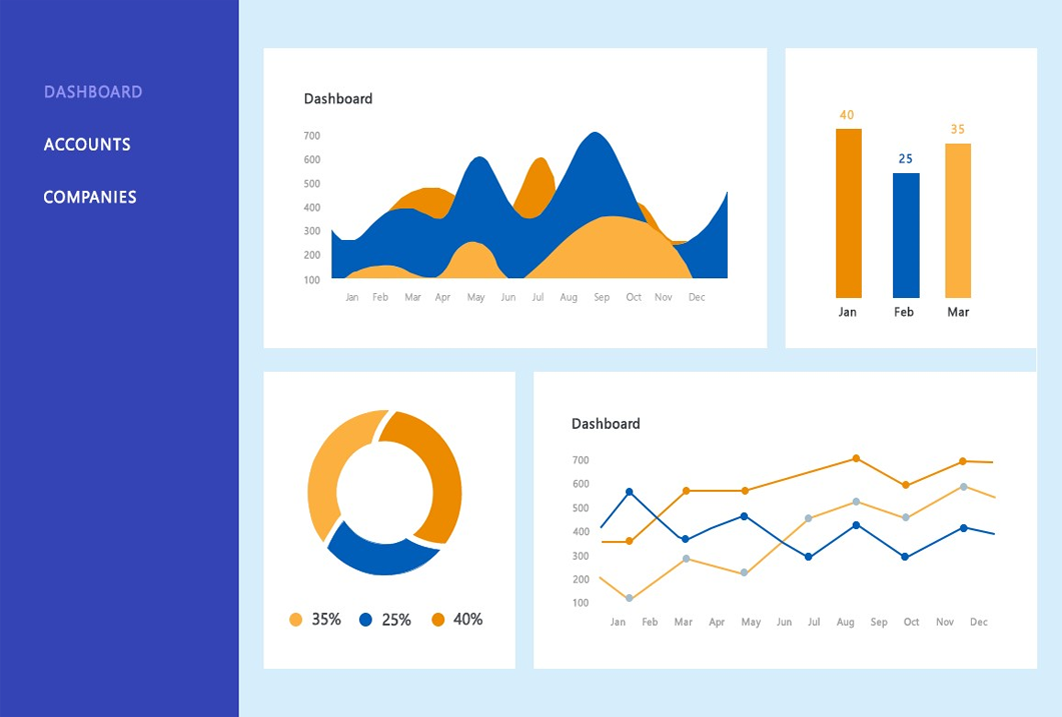
Custom charts
 ×
×
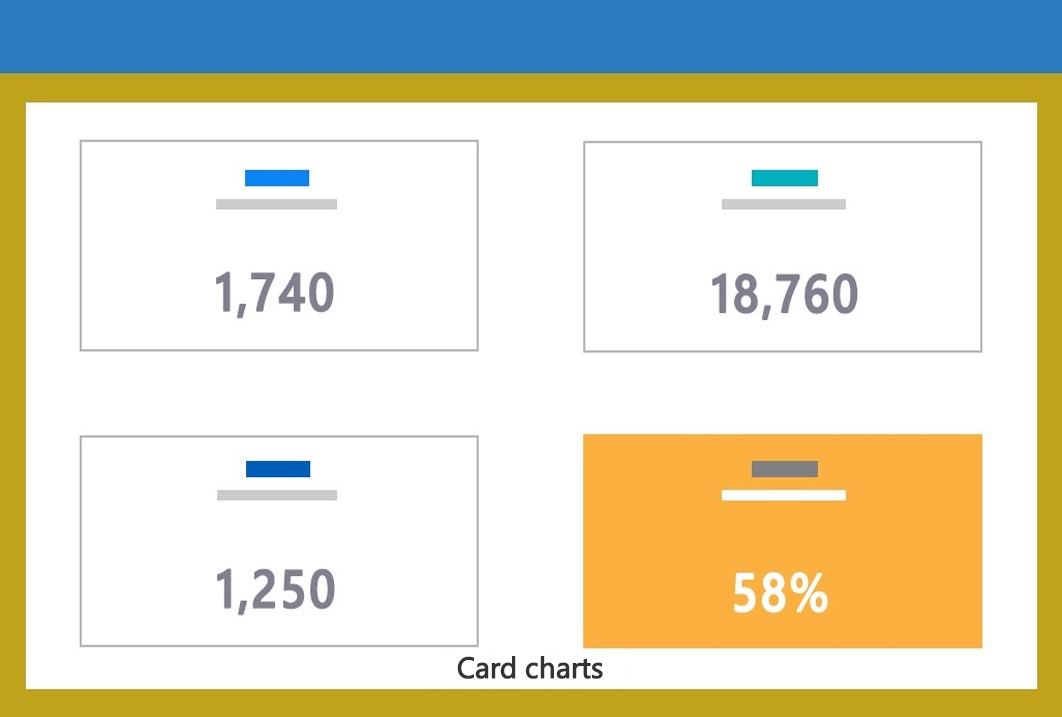
Card charts

Technologies We Use
Data Visualization

EezahTech specializes in configuring Power BI to analyze data from diverse sources and present insights in a user-friendly format.

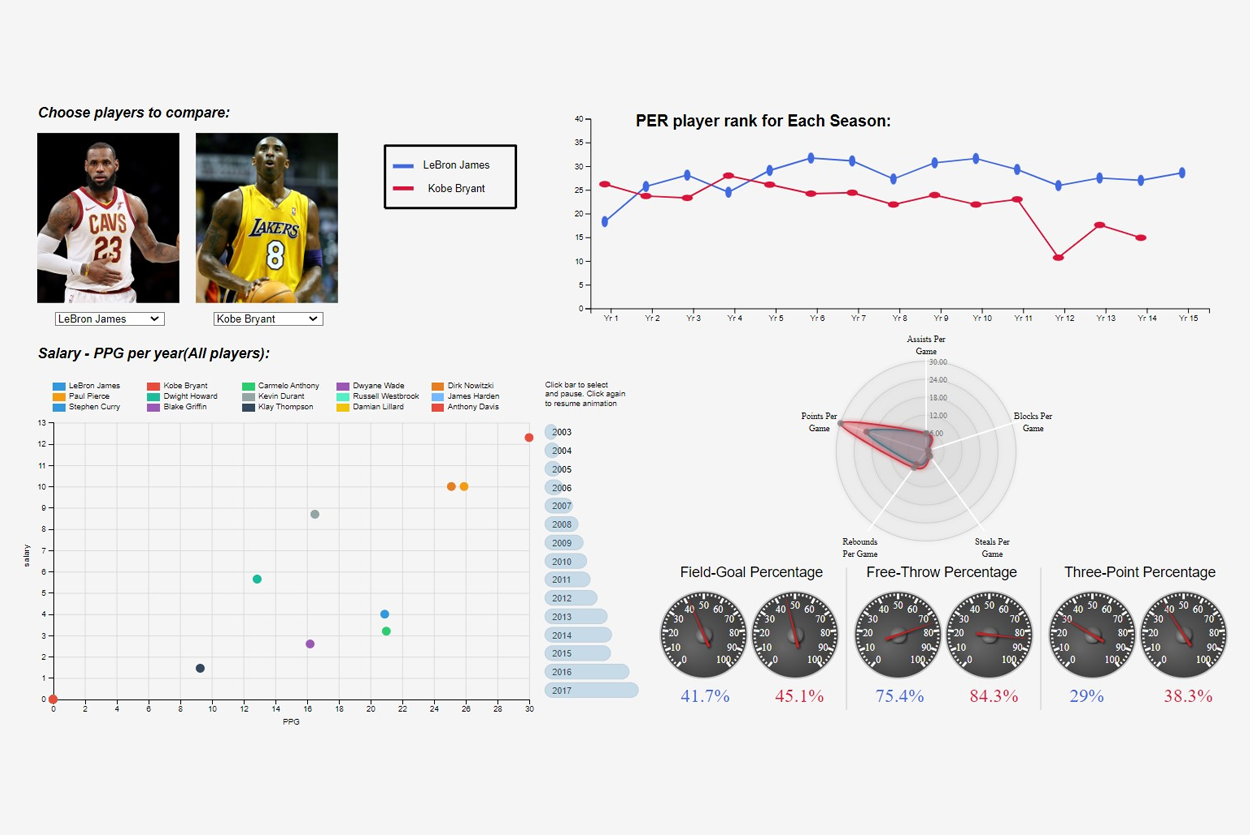
EezahTech has implemented D3.js to seamlessly process data from various sources and create user-friendly dashboards.

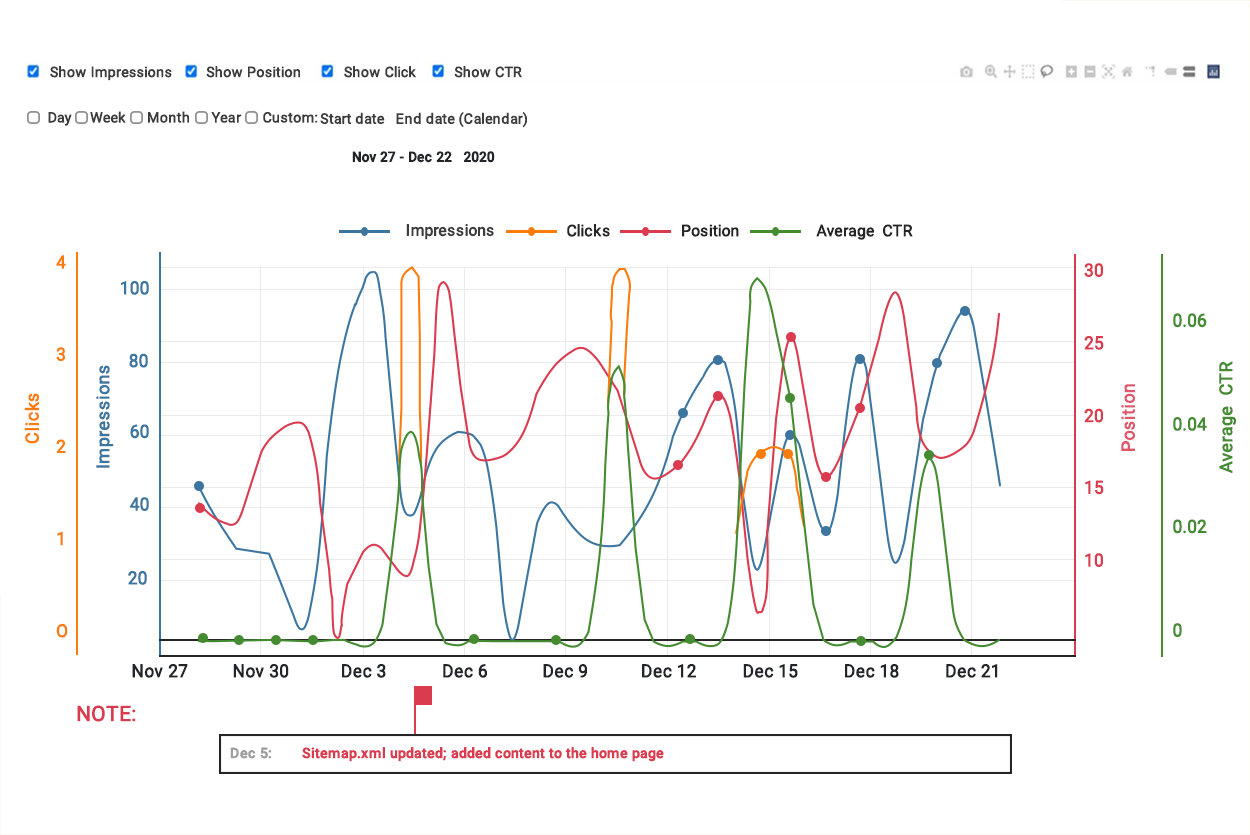
EezahTech leverages the power of Plotly.js to seamlessly process data from various sources, transforming it into visually engaging and interactive graphs and charts presented in a user-friendly format.

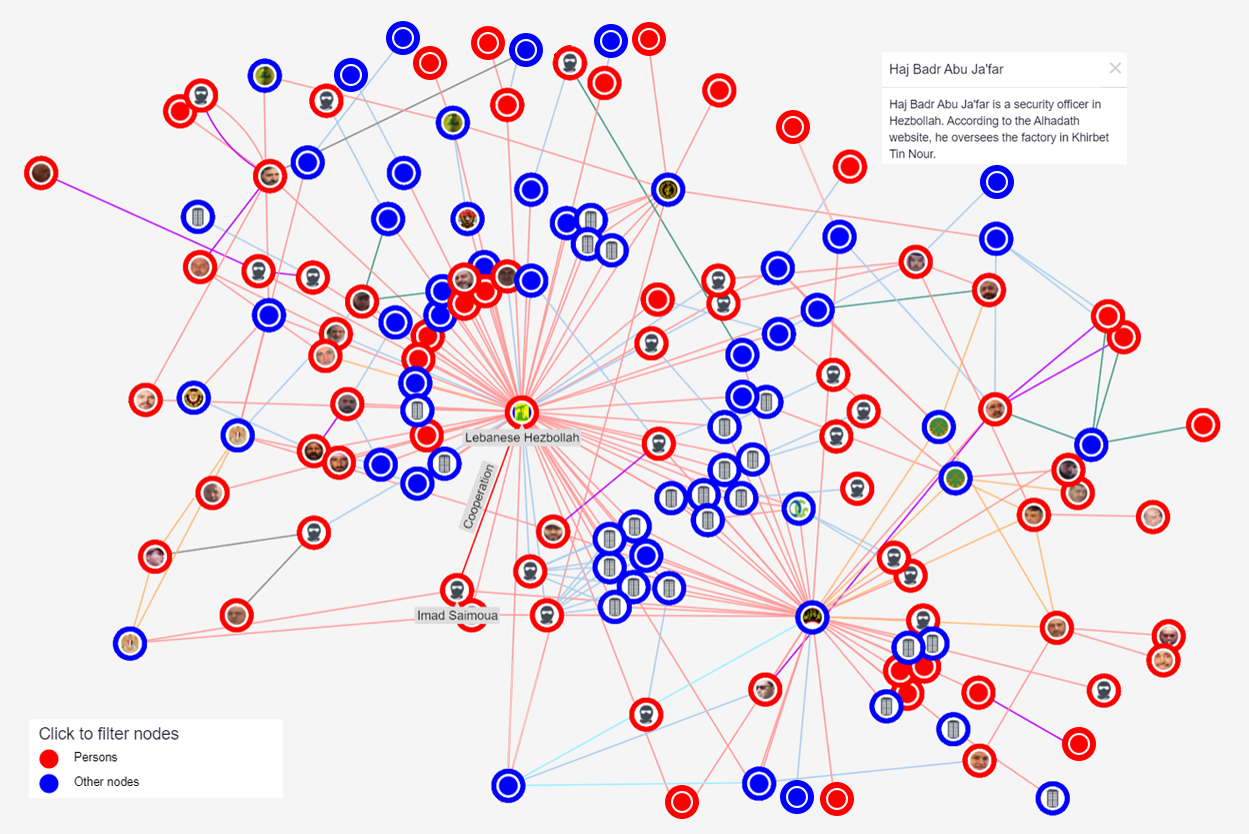
EezahTech harnesses the power of ogma to seamlessly display, explore, and interact with graph data within web applications, enabling the creation of interactive graph visualizations that deliver an immersive user experience.

EezahTech employs Chartist to seamlessly analyze data from sources, generating user-friendly charts and graphs that showcase patterns and trends.

Eezahtech leverages Tableau to craft a wide array of charts, graphs, maps, and dashboards, facilitating the visualization and analysis of data to support informed business decision-making.

EezahTech implements Highcharts to efficiently process data from different sources and generate interactive charts in a user-friendly format.

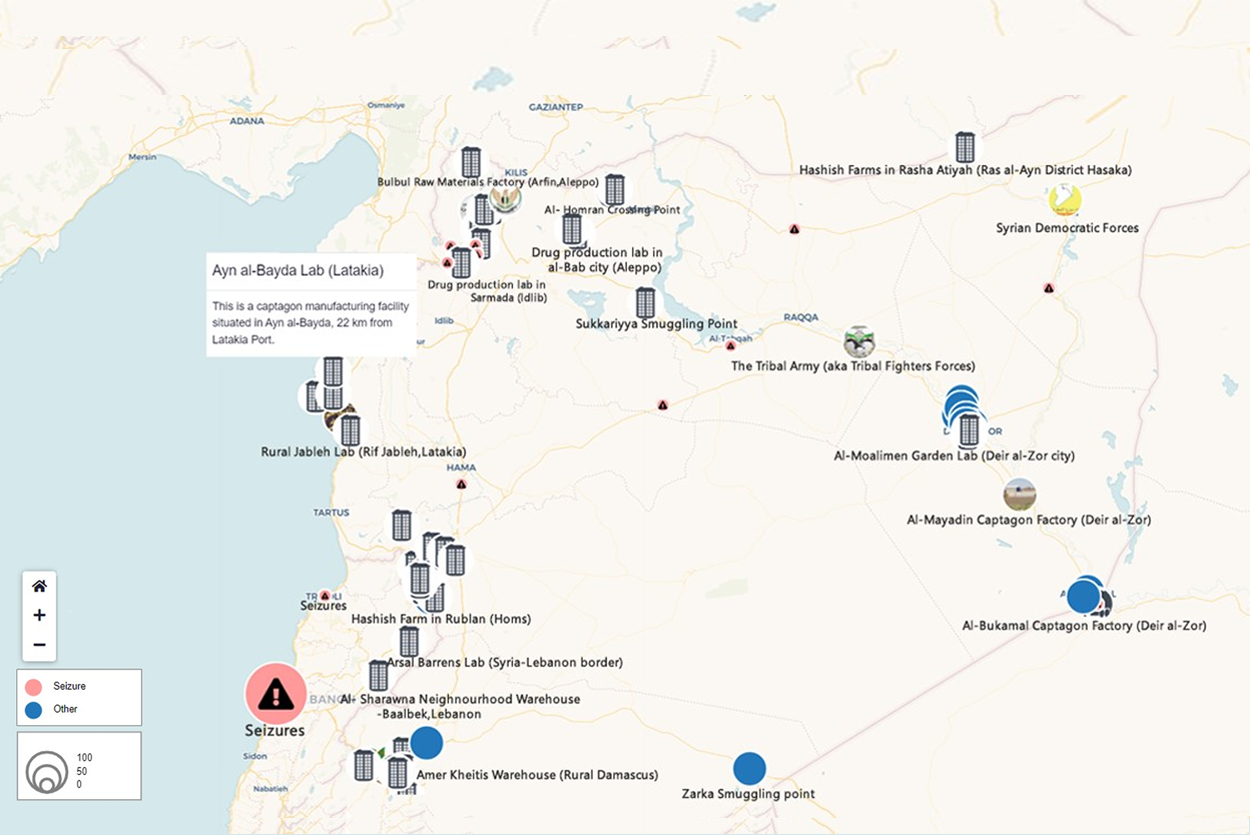
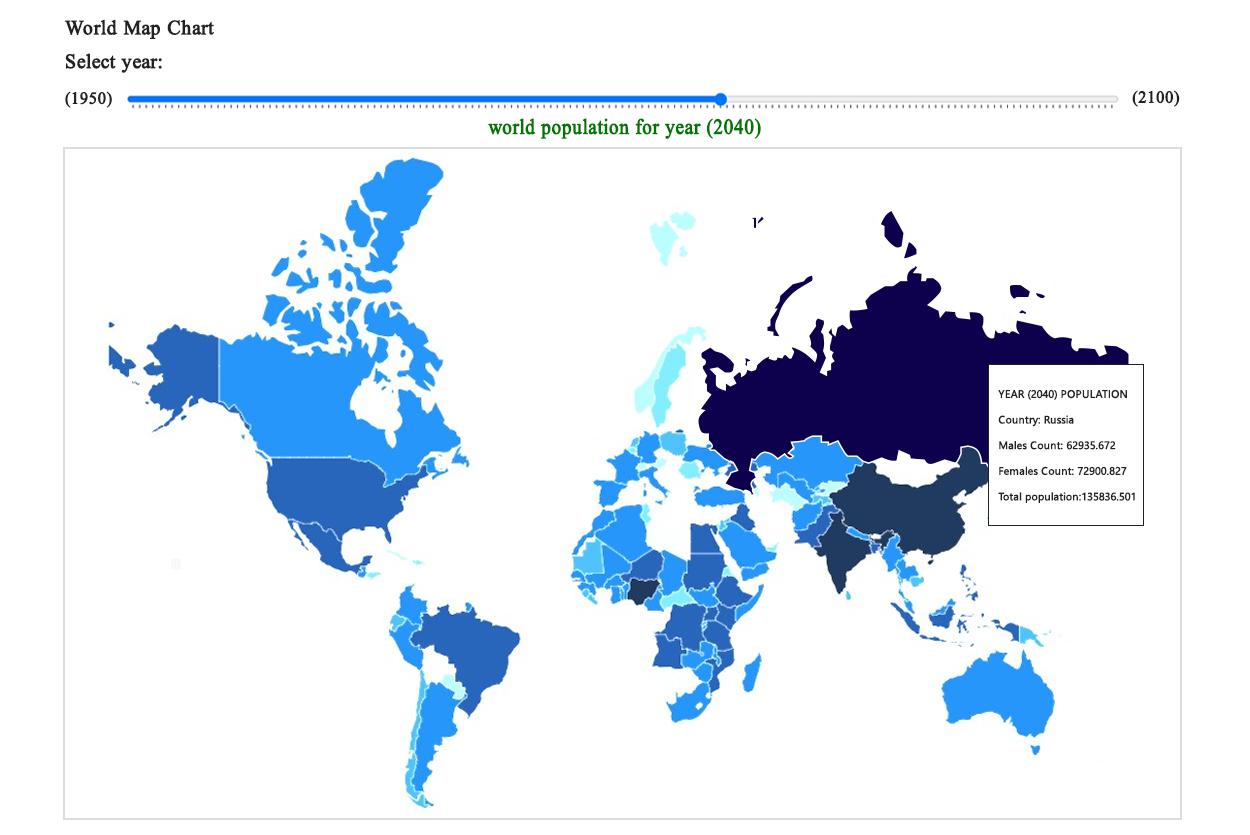
EezahTech leverages the power of Leaflet to seamlessly process data from various sources and craft interactive maps that deliver an immersive user experience.
 ×
×

Our Data Visualization Portfolio
We offer data visualization services so that customers may look for trends, track the accomplishment of business objectives.


